EARTH OBSERVATION
OBSERVATION
OF THE ATMOSPHERIC SODIUM LAYER
AT 90 KM IN THE MESOSPHERE
The Mesosphere is interested by important
chemical and dynamic phenomena, so that observation of its Sodium layer has
became a common target of several research plans all over the world. In order
to extend the study of its dynamical and chemical variation we want to observe the Sodium
emission during daytime and perform differential analysis looking for periodic
changes. Using a small telescope, a Magneto-Optical Filter and a CCD camera
onboard the International Space Station, we avoid the uncomfortable LIDAR
technique taking advantage of the solar flux to stimulate the Sodium emission.
author
CACCIANI
UMBERTO
|
co-authors
GUIDA ROBERTO, IACOBELLI MARCO
|
|
UNIVERSITY OF ROME
“LA SAPIENZA”, PHYSICS DEPARTMENT,
SOLAR PHYSICS G-28
LAB, PIAZZALE ALDO MORO 5, 00185 ROME, ITALY
|
TABLE OF CONTENTS:
1 PROJECT DESCRIPTION
1.1
Introduction-Rationale
1.2 Research’s goals
1.3 The
technique
1.4 Signal-to-Noise ratio
1.5 Data
Analysis
2 INSTRUMENT’S DESCRIPTION
2.1 The magneto optical filter
2.2
Image Sensor
REFERENCES
|
View/Download (2,412,651 bytes) Word zipped file
View/Download (8,109,557 bytes) PPT and AVI zipped files
|
Earth Observations
Observations of the
Atmospheric Sodium Layer @ 90 Km in the Mesosphere
Abstract
Using an imaging
technique we want to extend the observation of the Mesospheric Sodium layer to
many points of a large bidimensional region at the same time. So far, in order
to partially achieve this goal, networks of LIDARs have been conceived from the
ground, but our way is to go to space and use a very narrowband Sodium filter to reject the rest of the unwanted solar
spectrum. The solar light replaces the laser beam to excite the Sodium atoms.
1
PROJECT DESCRIPTION
1.1 Introduction-Rationale
|
The atmosphere of the Earth contains a layer of
metallic Sodium. Even though almost 30 years have passed since the first
routine investigations by Gibson,
Standford and Bowman have been made [1
and 1bis], we still have no definite answers about its origin, large scale
properties and temporal evolution. This lack of knowledge is the basic reason
why several research groups, all around the world, are working on this field
and, definitely, constitutes the main trigger for our proposal.Neutral atoms of Sodium have been first
discovered by Slipher in 1929 [2] and they are located between 80 and 105
Km in the Mesosphere (Fig.1 and Fig.2).
The peak density of its sodium layer is around 90 Km at a level of 109÷1010
atoms/m3 and its investigation faces some difficulties:
-
its
altitude is not suitable for balloons (too high) or for orbiting satellites
(too low)
-
the
background solar daylight radiation, diffused by the atmosphere is far
exceeding its faint yellow glow, leading to
the problem of the signal to albedo noise, discussed in section 1.5
|

|
|
Fig. 1 Relative highs of various
componrnts |

Fig. 2 Pictorial composition of the
International Space Station with the Earth below, where the relative altitude
and thickness of Na layer and blue
atmosphere at the limb are shown.
As far as the first point, LIDARs (systems
composed by a powerful laser which excites the atmosphere, coupled with a
fairly large telescope to collect the backscattered radiation from the various
components) have made possible accurate observations, limited however to
point-like targets only, so precluding large scale field of view (FOV) and
spatio-temporal studies of its evolution.
As far as the second point, routine
observations are usually being performed at night time only, so precluding long
and uninterrupted temporal series to get better frequency spectra of its
variations. Attempts have been made during the day, reducing the divergence of the LIDAR beam or using
narrowband Fabry-Perot filters that, however, are affected by extreme thermal
and mechanical instability.
In spite of the above difficulties, the
Mesospheric Sodium is the most frequently studied metallic component of the
Earth's atmosphere because of its high backscattering cross section, ( 7·10-17 m2ster-1,
and abundance, 3·1013 atoms/m2 [2] ). However, so far, we
are not able to respond with certainty to the basic question of its origin, but can only list two possible
groups of Sodium sources:
·
Terrestrial
Sources ( volcanic dusts and salt particles from the oceans)
·
Extraterrestrial
Sources (meteorites and comet dusts with an additional component of gas from
the sun)
Most likely, ablation of meteorites and comet
dusts is the main source mechanism; however, difficulties arise when trying to
justify the observed abundance. Moreover, researchers find that the Sodium
layer is changing as a function of geographical coordinates, seasons and even
time during the day. Complex chemical reactions are taking place that involve many ions and neutral particles at high levels: all depending
from the basic parameter governing the evolution, that is the temperature (Fig.
3).
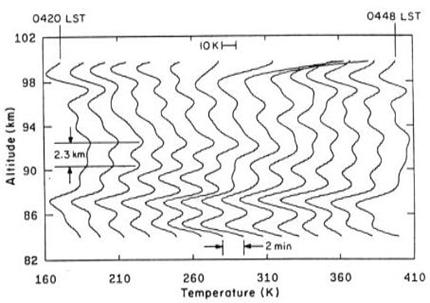
Fig. 3 Temporal series of temperature profiles.
Finally, one important aspect is its dynamical
behaviour, driven by the tidal effects and gravity waves . These effects, with
some contribution of atmospheric turbulence, are mainly responsible for short
periods evolution. The available data [1 bis] show oscillations of the Sodium
layer: in particular, density and
thickness oscillate in phase, while
the altitude is 180 degrees out of
phase. Moreover, sometimes, sporadic
layers are detected with very high
Sodium density and short formation time, whose origin is still not understood
(Fig. 4).
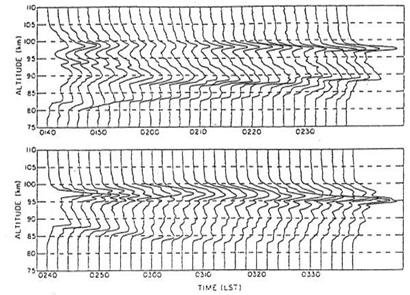
Fig. 4 Density profiles.
1.2 Research’s goals
Because of its high resonance cross section,
the Mesospheric Sodium constitutes a very good mark able to reveal waves and
short duration transients phenomena in the Earth atmosphere. For this reason
the main purpose of our experiment onboard of the ISS is to image and record
such events in order to:
·
further
clarify the source of Sodium from meteorites and comet dusts detecting its consequent
density variation . Since meteoric events are randomly localized in space and
time, we would need a continuous monitor of a large FOV.
·
get
evidence, and possibly obtain spatio-temporal Fourier analysis, of waves, both
tidal and gravity waves
·
try to combine our space
observations with other techniques from the ground. We plan to do this not only
using data available from LIDAR routine measurements but mainly from another particular project we
are in collaboration with: this is the 'Earthshine Project ' conducted at the Big Bear Solar Observatory
and Caltech in California. Form this project, it is possible to derive
the absorption profile of terrestrial Sodium comparing the illuminated side of the Moon with the
dark side of it. Indeed, this last side can see the solar light after
reflection by the Earth (Earth-shine). Since this light travels twice through
the Earth's atmosphere, it is possible to derive the absorption effect of the
Sodium layer provided the observations
are made at high spectral resolution. Fig. 5 shows example of such spectra
kindly provided by the Earthshine Project.

| Figure 5a: |
|
Figure 5b: |
|
The two plots on top are the sodium
D2 line spectra from the illuminated side of the Moon (left) and the dark side
of it (right). The bottom plot shows their ratio. This last is affected by the
terrestrial Sodium absorption. The spectral resolution, however, is coarse
compared with the Sodium line and the
MOF bandwidth (about 40 milliAngstrom). The temperatures and columnar densities
that is possible to derive are useful data
for other purposes also,
particularly Adaptive Optics [5]. |
|
variations with the atmospheric
temperature of the scattering total cross section in the resonant transition D2
of the Sodium hyperfine structure. |
1.3 The
technique
Referring to Fig.6 where our instrument is
shown as composed by three parts (a telescope, the MOF filter and an image
sensor), we want to stress here the importance and the characteristics of the
MOF (Magneto-Optical Filter). Indeed, the MOF is the core of the system that
makes this experiment unique. Its working principle is described in section 2.1
and will be provided by our adviser, Prof. Alessandro Cacciani of the
University “LA SAPIENZA” of Rome. Here let be enough to say that it
is a very stable and narrow band filter, about 50 milliAngstrom, achieving
unsurpassed performances of perfect
tuning in the core of the Sodium yellow lines. Its weight ( about 1 Kg)
and dimensions (10x10x10 cm3) are also attractive for space applications.
As a filter, it will be located between the telescope and the image sensor
(provided by JPL). In this manner we are able to reject all the other
wavelengths of the solar spectrum so that we can definitely say that the MOF
produces an artificial night, which is the necessary condition to detect the
faint yellow glow originated by the Mesospheric Sodium. The most important consequence of this artificial
night is that we can work in the presence of daylight, using
the solar radiation, instead of the uncomfortable LIDAR apparatus, to
get the Sodium excited; moreover, the
solar radiation is not localized,
as the laser beam is, and we can observe many points at once of a large
bidimensional FOV. A drawback of this otherwise ideal situation is that we must
compete with the albedo radiation from the Earth inside the same wavelength
pass-band of the MOF. This problem is discussed in the following section
devoted to the Signal-to-Noise ratio.

Fig. 6
Mechanical assembly of the instrumentation
1.4 Signal-to-Noise ratio
Here we
need to compute the expected signal and the competing luminosity from the
Earth.
As far as the expected signal, it comes from
the Sodium atoms . We have:
- average value of the Sodium columnar abundance
= 3· 10
13 atoms/m2 [3].
- cross section for resonance
scattering = 7·10-17 m2·ster
-1 [3].
The product of them gives the probability that
one single solar photon is scattered back from the Sodium layer inside one
steradiant. This amounts to 2·10-3 events per second and steradiant.
We need to compare this number with a similar
probability coming from the other components of the Earth, namely : the clouds, the oceans, the lands and the
atmosphere. Each component displays a
different albedo luminosity (clouds are white and oceans are blue), therefore
we want to select the observations in the most favourable condition for the
yellow part of the spectrum: that is, above the oceans and the air as a
background. Unfortunately, albedo data in the narrow MOF band width are not
available: only integral or wide band
spectral resolution data have been estimated in the whole solid angle (Fig. 7).
It is, therefore, possible that most of the measured yellow albedo from the
oceans or the air is coming from the high resonance radiation of the Sodium
atoms (which is our signal).
The above consideration, makes us aware that
our proposed observations from the ISS are unique and may be useful to interpret the albedo
behaviour measured by the “Earthshine Project” (planned collaboration).

Fig. 7 Earth’s energy budget
To give some numbers, let us take the yellow
albedo of the air (with the exclusion of
the Sodium resonance ) to be of the order of
10-2, that is less than 10-3 in a single
steradiant. This would mean that the above quoted resonance
probability is larger than the albedo in the same spectral bandwidth. We add
that at the terminator (the twilight zone) the Sodium layer @ 90 Km is excited by the solar radiation while the
Earth’s atmosphere is not completely illuminated: so that the situation is even
more favourable .
As a final step, in order to select a suitable
detector, we need to estimate the total
number of photons reaching our image sensor . This can be done multiplying the
resonance probability by the solar photon flux
inside the MOF bandwidth. It amounts to 7.4·1015 photons/s/m2 [7] which must be further scaled by the
acceptance solid angle of our apparatus.
Considering an altitude of 400 Km for the Space Station and 90 Km for
the Sodium layer, we get 10-13 steradiants for a 5 cm aperture
telescope, and 4 times as much for 10 cm aperture, giving a useful photon flux
of about 3·103 from each square meter of the Sodium
layer seen from the Space Station. We
need now to convert this number into pixel illumination of the image sensor. The magnification factor of the telescope
optics is given by the ratio D/F (D=400
Km distance of the Space Station, F= focal length of the telescope) so that,
considering a typical figures of 10
microns for the pixel size and 0.4 meter for F, we find each pixel collecting
photons from 100 m^2 of the Sodium layer. This brings the photon flux to be 3·105 photons /s per pixel, a
fairly measurable quantity even
considering a further reduction of a factor 10 caused by the overall
quantum efficiency of the Optics ( MOF included). Actually, the photon flux must be increased by about a
factor two to include the albedo
contribution. Note, moreover, that when we look at differential signals between
frames, the albedo background is cancelled.
The image sensor for this experiment will be
provided by the Jet Propulsion Laboratory (JPL) of Pasadena, California (sect. 2.2).
1.5
Data Analysis
The first order data analysis is to perform
suitable time lag differences in order to get evidence of transient events,
specially during the times of Leonids, Perseids etc. In this manner we can
visualize the location and geometrical configuration of any glow increase. The
temporal coincidence with the periods of known meteor swarms, will witness
about their credibility. Then we can try
to evaluate the consequent density variation in the nearby regions. Depending on the system sensitivity
to small variations we can also try to get evidence of waves and look at spatio-temporal Power Spectra of the observed surface
oscillations [6] (see also Fig. 8 as an example of monochromatic solar image
through the MOF, showing faint Sodium
emissions otherwise invisible).
As a final remark, giving the perfect spectral
stability of the MOF, we are able to scan across the Sodium emission line, taking advantage of the spacecraft
relative speed, ranging from
-7 Km/s to + 7Km/s, well covering the
whole line profile by Doppler shift.
This kind of
information, if prolonged in time,
are also useful also for other disciplines connected with the very important problem of global changes.

Fig. 8 An example of Sodium image
obtained with the MOF: note the visibility of the Sodium emission regions.
2
INSTRUMENT’S DESCRIPTION
2.1 The magneto optical filter
The Magneto-Optical Filter (MOF) is a
particular instrument that gives a really narrow bandwidth, high transmission (almost 50%) and perfect
stability. It can work only in a small range of
wavelengths, well defined, like Na and K doublets, and can be thought as
an high resolution spectrograph within those wavelengths.
It was developed by Alessandro Cacciani at the end of the ’60s (see references and
images in www.solobskh.ac.at). Its main use is for the study of the sun; during
the last years it has been adopted also for the analysis of Jupiter oscillations and to observe the mesosphere in daylight
(paper in preparation ).
A complete MOF instrumentation is
made of two separated unit: the MOF itself and the WS (Wing Selector)
that, together, provide accurate Doppler
and magnetic measurements. In this proposal,
however, we just need the first simple unit. It is composed by two
crossed polarizers (P1, P2) and a metallic vapour (Sodium
in our case) between them in a longitudinal magnetic field  (2000¸4000 Gauss). A schematic diagram of the filter is shown in
Fig. 9.
(2000¸4000 Gauss). A schematic diagram of the filter is shown in
Fig. 9.
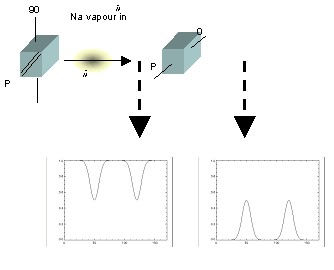
Fig. 9 Schematic diagram of the
MOF filter (top) and spectral behaviour along the optical path. Following the
Zeeman rules, the vapour immersed in a magnetic field absorbs two circularly
polarized components, leaving the residual light also circularly polarized (in
opposite direction). This wavelengths cannot be stopped by the crossed polarizers and are transmitted as a
couple narrow bands that can be close at will (depending on the magnetic field
strength).
The working principle of the MOF is based on two concurrent effects, namely
the Zeeman effect in absorption as discussed in Fig 9 and a sort of Faraday rotation close to the line’s wings
called Macaluso-Corbino effect. Both change the polarization in and around the
resonance lines, leading to total transmission profile typically
shown in Fig. 10.
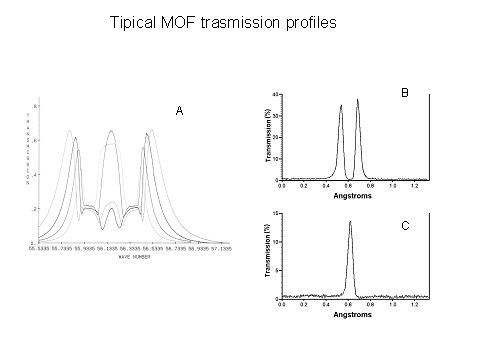
Fig. 10 experimental transmission’s profile at
different temperature and magnetic field values: in this experiment we use a
single band transmission 10c.
2.2
Image Sensor
The information in this paragraph are from Dr. Cunnigham of JPL [7].
The Active Pixel Sensor (APS) is a CMOS-based
visible image sensor
Because CMOS parts can be manufactured on
demand and because CMOS is the process presently used to make almost all
digital and most analog components, the APS can be fabricated as a "camera
on a chip" where all of the timing and control circuitry are integrated on
chip with the imaging circuitry. This allow the construction of a single chip
digital camera.
For this effort the APS imager would be used
behind the Sodium filter.
This would allow the APS to directly image the
sodium line emitted from the atmosphere. It is envisioned that the APS would
take exposures on the order of 1 second duration, in which approximately 1000
photons would be collected by each pixel. The quantum efficiency of
scientific-quality photodiode active pixel sensors is approximately 50% and the
noise floor
is approximately 50 electrons rms, which is
more than adequate for this application. The APS would digitize the signal
directly on-chip, and would transmit the image using a standard digital
interface .
REFERENCES
[1] BOWMAN, M.R., GIBSON A. J., STANDFORD M. C.
W., ’Atmospheric Sodium measured by a tuned laser radar’ Nature, 221, 457-459,
1969.
[1bis] CONTENTO,
CARLA, “Studio preparatorio di strumentazione per misure di Sodio mesosferico
in luce diurna”; Tesi di Laurea, Dipartimento di fisica, Università degli Studi
di Roma “ La Sapienza”, 26/9/2002.
[2] SLIPHER, V. M., “Emission in the spectrum
of the light of the night sky”, Publ. Astron. Soc. Pacific, 41, 262, 1929.
[3] HUMPHREYS, R. A., L. C. BRADLEY, J. HERRMANN, “Sodium-Layer Synthetic Beacons for Adaptive
Optics” ; Lincoln Laboratory Journal Special Issue on Adaptive Optic, volume 5,
number 1, 45, Spring 1992.
[4] FOUKAL, P., “Solar Astrophysics”, John
Wiley & Sons Editors, p. 67, 1990.
[5] PATRIARCHI, P., A. CACCIANI, "Laser Guide Star Adaptive Optics:
Measuring the Sodium Density Using a Magneto-Optical Filter" Astron.& Astrophys, 344, L45, 1999.
[6] HARVEY, J., “Helioseismology: The State of
the Art”, Fourth Soho
Workshop ESA SP-376 April 1995
[7]
Dr.
THOMAS J. CUNNINGHAM, private communication, 2002.
Acting Group Supervisor
Advanced CMOS Sensor Technology Group (387-I)
NASA Jet Propulsion
Laboratory
Ph. (818) 354-0891
Fax (818) 393-0045
e-mail: Thomas.J.Cunningham@jpl.nasa.gov